Returning to an Important Subject: the Vulnerability of the U.S. Electrical Grid

I’ve just had an amazing experience – I listened for about an hour to an online advertisement for an investment newsletter. You may reasonably ask why would any compos mentis individual devote an hour of their life to an advertisement for a service that he was unlikely to sign up for? My answer is simple – the ad addresses an important issue that I have touched upon in earlier blog posts, and in accurate terms once you sift the wheat from the chaff of a much too long presentation. It also presents a worst case scenario to get your attention, a common advertising technique, but it also presents information on what I consider a significant national security risk – the vulnerability of our national electrical grid system to natural or malevolent events. The ad, in its infuriating stretched-out discussion, addresses this vulnerability from four sources – sabotage, solar flares, cyber attacks, and military attacks. The ad’s discussion includes references to federal government and NARUC (National Aassociation of Regulatory Utility Commissioners) reports that address Black Sky Day possibilities and which are easily accessed. Black Sky Days are defined as “extraordinary and hazardous catastrophes utterly unlike the blue sky days during which utilities usually operate.”

My concern about the grid vulnerability issue goes back about thirty years and has only grown with time. I truly believe we are a highly vulnerable society and are not yet paying enough attention to our vulnerabilities. I hope I am wrong.

In any event, I present the link to the ad below (I wish it had an Executive Summary) and to my two previous blog posts that discuss the vulnerability issue. We need more attention to these perhaps unlikely events but ones with potentially massive consequences.

1. The Black Sky Days Event Is “Imminent” – The Oxford Club
http://pro.oxfordclub.com/DDSKY3959PESDBNETTTSOXFJVIUPS4/PORER800/?h=true

2. The Vulnerability of Our Electric Utility System to Cyber Attacks

The Vulnerability of Our Electric Utility System to Cyber Attacks

3. Vulnerabilities of U.S. Infrastructure: We Need To Pay More Attention

Vulnerabilities of U.S. Infrastructure: We Need To Pay More Attention

Investing In Solar Energy: If Only I Was Younger

As I write this early in my 79th year I am aware not only of my mortality (although I don’t spend much time on that except for getting my bucket list and will in order) but also of the investment opportunity that is coming and that I can’t really take advantage of. It’s long term, longer than I likely have.

It is the realization that the solar revolution is finally unfolding and that we are in the early stages of a sea change that will change the energy picture in major ways for our children and grandchildren over the next few decades of the 21st century. It is an exciting time to be alive, with all the changes coming, but the transition will take time as history teaches. There will also be ups and downs along the way – e.g., the fact that some governments in Europe recently and retroactively cut subsidies and Introduced import tariffs on low cost Chinese solar panels. But the long-term trend is clear.

I say this after forty plus years in the clean energy field, going back to 1969, and being overwhelmed recently by the burgeoning literature on solar and other renewables that appears on my iPad every day – e.g., the following interesting and encoraging piece on ‘community solar’ that appeared recently in the journal Energy and Environment :

image

“There’s a tense dynamic accompanying the rapid growth of solar in the United States—in which traditional utility companies, nervous about the spread of rooftop solar panels, are seeking ways to limit the revenues made by solar customers who earn credit for the extra electricity they provide to the grid.

This battle over so-called “net metering” has been often depicted as a zero sum conflict between an upstart and an incumbent — but new research out of the University of Texas at Austin suggests there could be a kind of “middle ground” in the conflict between some utilities and solar installers.

The potential “win-win,” as the researchers put it, involves so-called community solar — solar energy projects or panels that are in effect shared by a group of people, such as the inhabitants of an apartment building, rather than sitting on a single residential rooftop. The study, recently published in Energy Research & Social Science and led by Erik Funkhouser of the LBJ School of Public Affairs at the University of Texas at Austin and three university colleagues, found that at least some utility companies seem to like community solar programs, are already offering them, and plan to expand them.

One key reason? Customers clearly want access to solar, and some utility industry representatives find community solar to be a great way to give it to them — in a manner that allows the utility to continue to service these customers’ full electricity demand, that is.

“If you are a utility that is concerned with the rapid growth of residential solar — which means that a lot of the demand is moving away from your direct control — in that case you can imagine developing a competitive community solar program that is priced around what a residential system or residential lease might look like, and you might actually price it lower,” says Varun Rai, a professor of mechanical engineering at the University of Texas, Austin and one of the authors of the study.

The research also suggests yet another way — beyond getting directly into the business of installing rooftop solar, as Southern Company subsidiary Georgia Power is now doing — that traditional power companies seem to be finding their way into the hot solar market.

Community solar has certainly been getting a lot of attention lately — largely because of its vast potential to expand solar access.

Last month, the Obama administration announced an array of new initiatives to broaden access to solar energy to more Americans — since so far, solar has generally been the province of relatively wealthy homeowners. Solar City, the top U.S. solar installer, recently announced a massive project to install some 100 “solar gardens” in the Minneapolis-St. Paul area, with a particular focus on allowing renters to participate in solar energy. And GTM Research, which studies the clean energy industry, projects that community solar will be “the most significant solar growth market for the United States.”

[Many Americans still lack access to solar energy. Here’s how Obama plans to change that]

The new study adds to the theme, reporting on the results of seven utility industry interviews about community solar, as well as the responses to 57 surveys on the subject distributed to investor owned utilities, municipal utilities, and rural electric cooperatives. The researchers also analyzed 61 community solar projects. And they concluded that community solar has the potential for “stabilizing the customer-utility relationship with deeper solar penetration.”

In effect, this is happening because some utilities seem to realize that they’ve got to get involved in the solar wave, the sooner the better. Or as the study put it:

One utility reported that, even without significant penetration of residential solar PV in its territory, staving off potential attrition of its customer base partly drove its adoption of a [community solar] program. Another utility, a large [investor-owned utility], reported that it was motivated to pursue [community solar] for the same reason. The organization anticipates increases in the popularity of solar [distributed generation] going forward. By investing in [community solar] it hopes to satisfy customer demand for solar [distributed generation] as cost-effectively as possible.

The state of California has even mandated that its three main utilities — Pacific Gas and Electric, Southern California Edison, and San Diego Gas & Electric — begin to offer community solar programs, and on a large scale. The utilities are slated to set up 600 megawatts of community solar capacity by 2019.

PG&E’s community solar program, for instance, will allow customers to sign up to get either half or all of their electricity from solar projects that PG&E will “contract with,” or separately make an agreement with an outside solar installer to purchase some of that installer’s electricity gene
ation. Either way, the customers get billing credit from PG&E for not needing to use as much traditional electricity any longer. Initially there will be a premium to be in the program, but PG&E says that will “likely diminish over time if PG&E’s overall generation costs increase and solar costs fall.”

Other community solar programs offered by utilities include the Bright Tucson Community Solar program, offered by Tucson Electric Power, and the Sacramento Municipal Utility District’s SolarShares program.

Granted, for now only a relatively “small fraction” of utilities appear to be moving into the community solar space, according to lead study author Erik Funkhouser. And of course, not all community solar programs are offered by utilities. A group of individuals might start one of their own, of their own volition. A project might also be carried out on a nonprofit basis.

One major difference, notes Rai, is that when individuals set up a community solar program, they often do so with so-called “virtual net metering,” which allows participants in the program to get credit for the electricity generated and thereby reduce their electricity bills, in much the same way that residential solar owners do under current net metering schemes. The only difference is that they don’t actually own the equipment or have it on their own roofs — rather, their credit is divided up virtually among participants in the community solar program.

Rai thinks utilities won’t go for this arrangement, for the same reason that they’ve been so resistant to net metering in general. “For all practical purposes, the only difference between virtual net metering and net metering is, you don’t have the system on your roof,” he says. “But for the utility, you are exactly the same on your bill.”

The power company is still losing out on a portion of the individual’s electricity demand in this case — what has been termed “load defection” — so Rai thinks that utilities will try to offer community solar customers cost savings in a different way: through economies of scale. As prices for solar get lower and lower, community solar plans offered by utilities might simply become a good deal. “It just comes down to what the rate plan is,” Rai says. “If you give me a solar plan that has a benefit, then sure.”

Whether those in the solar camp will agree this is a “win-win” is not so clear, of course — virtual net metering could be the new sticking point.

So in sum, it’s far too early to know yet how this is going to play out — but it’s just another sign that we can expect major dynamism in the solar space, not only due to growth overall but as incumbent utilities try to compete with the upstart solar industry. For now, utility-offered community solar is just the latest indication of that.

“It’s a very early phase of a very interesting business model,” says Rai.”
………………….

I could list many other articles that lead to the same conclusion, that some U.S. utilities have finally begun to come to grips with the reality that renewable energy (not just solar but also hydropower, wind, geothermal, biomass, ocean energy), when combined with a smart national grid and cost-effective energy storage, can eventually provide the vast majority of our electrical energy needs, including the anticipated demand growth from electrified transportation vehicles. Utitilities in Germany came to this conclusion earlier, largely due to Germany’s energy policy that encouraged installation of wind, solar, and other renewable energy technologies through provision of so-called feed-in tariffs (FiTs). FiTs is a policy mechanism that provides an extra fee (tariff) above the retail rate of electricity to provide long-term security to renewable energy producers, typically based on the cost of generation of each technology.

At this point in time solar energy is the fastest growing energy source in the world today, having recently passed wind energy for this distinction. Of course solar starts from a small base and has a long way to go to provide a significant share of the world’s electrical energy. Nevertheless, when one looks at recent trends in various countries such as the UK, China, India, Australia, and others, let alone the U.S., it is clear that large parts of the world have accepted the inevitability of a renewable energy future, with a large part of that future being based on solar energy. In addition, African nations are beginning to expand their economies and take advantage of their extensive renewable energy resources, particularly solar, and the related investment opportunities are huge.

All this leads me to believe that the transition to renewables is well underway and offers not only investment opportunities for those with insight and patience, but also a response to the challenge presented by global climate change. With care being paid to where the investments are made, the financial returns should be quite impressive in the decades ahead. If only I were younger.

Does It Make Sense to Add Storage to a Home Solar System?

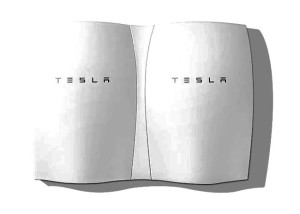
A topic that is receiving increasing interest of late is the possibility of adding electrical energy storage to a home solar power system. This latest tweak on use of solar energy for powering homes and businesses was stimulated by Elon Musk’s recent announcement that Tesla, his electric vehicle automobile company, will be marketing 7 kWh and 10 kWh Li-ion battery Powerwall storage units at lower-than-anticipated costs ($429/kWh and $350/kWh, respectively) in the near future.

image

Shortly thereafter, Daimler, another automobile manufacturer (Mercedes Benz), announced that they would be doing the same come this September, and the Australian utility AGL Energy announced that they will be offering 7.2 kWh systems at under $10,000 each. These announcements opened the analytic floodgates and numerous articles have appeared since on the costs-benefits of adding storage to solar systems.

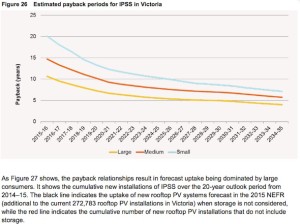
The general consensus seems to be that adding storage systems to solar systems on individual homes today is still a bit dicey – payback times at current prices can be a decade or longer (see chart below for Victoria, Australia) – but that large scale use by utilities can offer significant operational and cost advantages. Of course payback depends on the size of the storage system, storage costs now and in the future, size and cost of the associated solar PV array, the structure of electricity tariffs and incentives, the regulatory environment, and the size of the solar resource.

image

This blog post was stimulated by a sense that, with recent progress, things solar are getting complicated, and a specific question from a colleague who asked if it made economic sense to add storage to a home PV system. In my desire to get a better handle on this question I’ve read quite a bit of the available literature but still wanted to do some simple calculations for myself to feel comfortable with the more detailed answers now becoming available. I hope this simplified approach helps others as well as myself understand the pros and cons of this transformative change in our energy system.

After thinking briefly about how to do this ‘back-of-the-envelope’ calcution I thought it best to start with an even more basic question: Does it even make economic sense to put a solar array on my roof? While the cost of PV systems has decreased dramatically in recent years, mostly due to economies of scale in manufacturing, electricity costs in the U.S. are still pretty low compared to prices in much of the rest of the world, and cost-sensitive consumers may be skeptical of the solar economics. Of course there are other reasons for going solar even if the kWh costs are more than utilities are currently charging. These include a desire for backup daytime power during power outages, which stimulated significant demand for solar in California when the state experienced brownouts/blackouts in the 1990s. Storage obviously helps here as well.

Other reasons are cost if one is far off the grid (power line extensions are expensive), a desire to get fully off the grid, a hedge against future increases in the costs of utility power, or to reduce one’s environmental impact by reducing demand for fossil fuel generated electricity. In the case of utilities solar may be part of a program to meet mandated environmental constraints and renewable portfolio standards (e.g., 20% renewables by 2020), while recognizing that solar may reduce cost uncertainties associated with dependence on often volatile fossil fuels and provide other ancillary benefits for grid control and stability.

For purposes of calculation I will make the following assumptions:
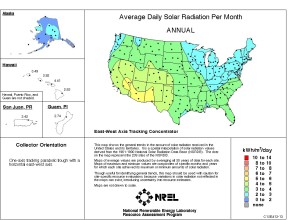
– solar insolation numbers for the U.S. will be derived from maps produced by the National Renewable Energy Laboratory (NREL). For my home in Virginia I will use an average insolation of 4 kWh per square meter per day and a solar-to-electricity conversion efficiency of 20%.

image

– the solar array will consist of fourteen 250 peak watt panels, for an array total of 3.5 kW peak. Each panel will have a surface area of 1.65 square meters. (Note: these numbers are taken from vendor offers on the web). Installed cost will be $3.50 per peak watt.
– total daily consumption is 30 kWh (10,950 kWh per year)
– average electricity costs are 12 cents per kWh
– no incentives from federal or state governments (note: these can make a difference in required investment and can be easily included in these calculations)
– a 10 kWh storage unit will be installed at a total cost of $5,000

image

(Note: the reader can use his/her own assumptions in redoing these transparent calculations.)

At 10,950 kWh annual consumption at an average cost of $0.12/kWh, the annual electricity bill, pre-solar, is $1,314. Total solar panel area is (14)x(1.65) = 23.1 square meters. At an average insolation value of 4 kWh per square meter per day the 14 panels intercept (4)x(23.1) = 92.4 kWh per day or 33,726 kWh per year. At a PV panel conversion efficiency of 20% this creates 6,745 kWh of electricity that offsets (6,745)/(10,950) = 62% of the demand from the utility. The resultant annual cost saving is (0.62)x($1,314) = $815. This is to be compared to the installation cost of
(3.5 kW)x($3.50 per watt) = $12,250. Thus, a simple payback period would be (12,250)/(815) = 15.0 years. With federal and state incentives that offset 30% of the installation cost the simple payback period would be reduced to 10.5 years. Since solar panel performance is now routinely guaranteed for 25 years, there would be many years of reduced energy bills after the payback period.

The problem for many people who wish to install solar on their roofs is the required upfront investment. Several solutions that reduce the upfront cost to zero or near zero have been proposed to address this barrier – e.g., leasing of the panels (often with the option to buy) from a vendor who installs the panels on your house, power purchase agreements (PPAs) where you agree to purchase the electricity produced by the panels at a set price for a set number of years, solar loans, and even putting the initial cost of installation into one’s property taxes and paying off the amount over many years as you pay your taxes. See, e.g., “Your financing options for your solar panel system: solar loans, solar leases and PPAs” at www.energysage.com/solar/financing/your-financing-options. Often these options provide electricity at costs lower than utility-provided power. Attractive financing options are the new holy grail in solar now that we have more experience with solar and panel costs have come way down.

Now let’s do a calculation that looks at the economic viability of installing a storage unit in a house with solar panels. Again, one must be clear about the reasons for adding storage – is it anticipated cost savings, backup power during grid outages, or the necessity of storage if one wishes to disconnect from the grid? With a large enough solar array and storage system an off-grid house can supply all its electrical energy needs day and night, but at a cost. This cost arises from the requirement of a larger solar array to power both the house during the day and generate enough spare electricity during the day to charge the storage unit and meet night-time needs. It also involves the cost of a storage unit, which at 7 or 10 kWh should be enough to meet most people’s night-time needs. This latter case (let’s assume a 20-panel array (5 kW peak) and the Tesla 10 kWh Powerwall) leads to an upfront cost of (5 kW)x($3.50/watt) + $5,000 = $22,500. (Note: financing options such as those for solar arrays are not routinely available yet for Li-ion battery storage units that are just beginning to hit the market. However, one can reasonably expect that they will become available in the not-so-distant future. The Australian Renewable Energy Agency (arena.gov.au) has just released a report which predicts a 40-60 per cent price plunge for certain battery technologies by 2020.)

Total available energy would be (33 square meters)x(5 kWh/day per square meter)x(20%) = 33 kWh per day. This should be adequate for most days of the year, including fully charging the storage unit, except for unusual extended periods of little sunlight. To cover that possibility a backup generator may be required.

Let’s compare this off grid situation cost-wise with our earlier solar panel example where 62% of annual electricity consumption was offset by solar generation, leading to an annual utility electricity bill of (38%)x($1,314) = $499, or $41.6 per month. This would increase to $45.8 per month if the size of the solar array was increased to provide 33 kWh per day.

Another number we might consider is the monthly cost if tariffs were higher, as they are in some parts of the U.S and many other parts of the world. For example, at a utility rate of $0.20 per KWh monthly electricity costs for the 3.5 kW system case would be $69.3 per month and $86.7 at $0.25 per KWh.

If one were to borrow the $5,000 cost of the storage unit as
a 30-year loan at 4% interest, a common situation in the U.S. today, the extra monthly payment would be $23.9.

Given these numbers, what might one conclude? Today, on a pure cost-saving basis it will take several years to recover the cost of a solar system, and even a bit longer for a system with storage. However, going the solar-only or solar + storage routes bring other benefits – the possibility of lower monthly electricity costs, protection against power outages and fossil fuel or nuclear power cost increases, reduced environmental impact by reducing demand on traditional fossil fuel-powered utility generators, and the possibility of leaving the grid, partially or fully. I also want to emphasize that these calculations will look quite different in future years as traditional power costs increase, costs of PV and storage systems decrease, financing options become more readily available and attractive, and people have more experience with solar and storage. In my opinion this trend toward solar is already happening and is inevitable, as is global movement toward an energy system based largely on renewable energy.

I know that these simple calculations have helped me get a clearer view of solar economics. I hope they do the same for others and provide some clarity about the key role solar energy and storage will play in the electricity supply of the future.
More sophisticated model results are available on the web.

The Yieldco and Its Impact on Solar Energy

The following important article was authored by Dr. Peter Varadi, a colleague, friend, and a true solar energy pioneer. It was published today (10 July 2015) in the e-journal energypost.eu, and is republished here with the author’s permission. An introduction was added by Karel Beckman, editor-in-chief of energy post.eu.

Solar Revolution Meets Wall Street
July 10, 2015 by Peter F Varadi

Introduction: The invention of the YieldCo is a gamechanger that will enable spectacular growth of solar PV, writes solar pioneer Peter F. Varadi. According to Varadi, the PV YieldCo offers significant advantages over investments in fossil fuel power: no fuel supply is needed, no long-term purchasing contracts for the generated electricity and less costly infrastructure. The solar revolution meets Wall Street.

Solar power in the US is still lagging behind China and Germany, but if solar pioneer Peter F. Varadi is right, America may well catch up pretty soon. The reason is the YieldCo. A typically American financial innovation that will act as a “solar breeder”, argues Varadi.

The YieldCo is essentially an independent power producing (IPP) corporation that operates renewable energy assets, such as wind, solar and hdyro. The company is publicly traded, “yields” a predictable cash flow, and distributes its income to its shareholders. Thus, it opens up the renewable energy (especially solar PV) sector to investment by small mutual funds and millions of private citizens. The far-reaching effects will become apparent over the next few years, says Varadi: the YieldCo will transform the US solar market.
………………………………..

In 1982 at Solarex, a company I co-founded in 1973 which had by then become the largest PV producer in the world, we envisioned a “Solar Breeder”. The idea was that we would manufacture solar cells and modules which would be mounted on the roof of our production facility to produce electricity which would then be used to produce solar cells and modules, etcetera.

With the completion of Solarex’s new solar cell and module manufacturing facility in 1982, the realization of this idea was started.

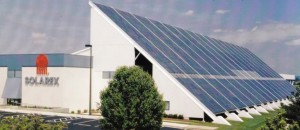
The slanted roof of the Solarex building (see photo) was covered with a PV roof producing 200 kW of electricity. The produced DC electricity was stored in batteries and converted to AC. The system was used to power 24/7 the production control systems.
image
The World’s first and at that time the largest (200 MW) rooftop PV system. Courtesy of Mr. Ramon Dominguez

The cost of PV modules in those days was quite high, but we were able to do this, because that was the time when we developed the multicrystalline wafer casting technique. We did not want to sell the early production before we had experience with PV modules produced from those wafers to ensure that the process worked well. So, the first 200 kW of modules were mounted on the roof of the facility.

The idea of the “solar breeder” was tested, but in those days to power the entire production of a solar cell and module production facility would have been prohibitively expensive. The idea went dormant.

The reincarnation of the “Solar Breeder” idea with an economic twist came about 30 years later. The Solarex idea was to produce solar cells and modules by utilizing the electricity generated by a PV system. The new “Solar Breeder” idea is to utilize the income generated by selling PV systems to finance the production of more solar cells and modules to build the next PV systems. The new “Solar Breeder” concept is called “YieldCo”. It is transforming the solar power sector.

The invention of the “YieldCo” system

The origin of the “YieldCo” idea in the USA goes back to 1960 when President Dwight D. Eisenhower signed the Real Estate Investment Trust (REIT) law. REITs are corporations which own and operate real estate properties and distribute their income to the shareholders. The REIT idea became so popular that at present REITs exist in 37 countries and in 2014 were listed globally on 456 stock exchanges.

21 years later the idea was extended to Master Limited Partnerships (MLP) pertaining first to “natural resources” such as petroleum and natural gas extraction and transportation. The first MLP was Apache Petroleum Company in 1981, based on oil and gas resources. The idea became so popular that it was adapted to a variety of industries.

In 2012, 52 years after the REIT financial program was started the “YieldCo” idea was initiated. YieldCo is basically the adaptation of the REIT program to Renewable Energy (RE), by forming an independent power producing (IPP) corporation to operate primarily RE (water, wind and solar) assets. The company is publicly traded, “yields” a predictable cash flow, and distributes its income to the shareholders.

The first YieldCo in the renewable energy field was Brookfield Asset Management’s subsidiary Brookfield Renewable Energy Partners. It was established – only 3 years ago – at the beginning of 2012 and is listed on the New York stock exchange (BEP). BEP’s assets are hydroelectric (80%) and wind plants (20%) scattered all over the world with a total installed capacity of about 7,000 MW.

The basis of the success of the YieldCos is manifold:

Because they are on the stock market the possibility of relatively small investment by mutual funds and small investment by private citizens opens the pocket book of millions.
Liquidity: one can get money out when needed.
Relatively stable cash flow: for example the electric yield of PV systems is predictable for at least 20 years and is not affected by political or financial crises which puts YieldCos, in terms of risk limitation, ahead of REITs or MLPs.
Result of the success of the first “YieldCo”

The stock market success of Brookfield opened up the floodgates to other RE YieldCos:

2013

April: Hannon Armstrong Sustainable Yield Infrastructure Capital Inc. (HASI) New York stock exchange (NYSE). [Financing energy efficiency projects also wind and solar]
July: NRG Yield Inc. (NYLD) New York stock exchange (NYSE) – [Wind, Natural gas, PV (12%)]
July: TransAlta Renewables (RNW) Toronto stock exchange. [wind 63% – Gas 31% and Hydro 6%]
September: Pattern Energy Group (PEGI) New York stock exchange (NASDAQ-NMS) – [Wind]
2014

June: Abengoa Yield (ABY) New York stock exchange (NASDAQ-NMS) – [50% concentrated solar thermal (not PV), 3% water, conventional power and Electric transmission].
June: NextEra Energy Partners (NEP) New York stock exchange (NYSE) – [77% Wind, and 23% PV]
July: TerraForm Power (TERP) New York stock exchange (NASDAQ-NMS) [Started with 100% PV, added recently some wind]. TerraForm Power was created by SunEdison, one of the biggest PV manufacturers in the USA.
2015

June 19th: 8point3 (CAFD) New York stock exchange (NASDAQ-NMS) First Solar and SunPower the other large PV manufacturers in the USA created a joint YieldCo by transferring to it PV systems.
2015 (planned)

TerraForm Global Inc.: SunEdison after its successful first experience filed an S-1 form with the U.S. Securities andExchange Commission (SEC) for this initial public offering to raise US $700 million.
NSP: Neo Solar Power Corporation at the moment the largest Taiwanese Solar cell and module manufacturer announced that it plans to announce Taiwan’s first YieldCo to be listed on the Hong Kong Stock exchange by the end of 2015.
YieldCos’ solar assets

As part of a YieldCo asset mixture the utilization of PV started in 2013 (e.g. NRG Yield Inc. – 12%).

In 2014 “Abengoa Yield” (ABY), a subsidiary of Abengoa S.A., a Spanish company, was the first YieldCo that had concentrated solar (thermal) systems (CSP not PV) as the majority of its asset mixture. Abengoa produces large scale CSP systems such as “Solana” (280 MW) located 70 miles southwest of Phoenix, AZ, and obviously had faith that their operation will be satisfactory. “Abengoa Yield” was created by assembling several CSP Assets in Spain and in South Africa and raised US $828 million.

But the most remarkable YieldCo in 2014 was SunEdison’s because it was the first PV manufacturing company which created a YieldCo [TerraForm Power (TERP)] consisting entirely of PV systems (utility scale PV 848 MW and distributed PV 283 MW). In 2015 SunEdison is planning to establish its second YieldCo (TerraForm Global Inc.). SunEdison was the first PV manufacturer to reincarnate the “Solar Breeder” ide a. SunEdison manufactured PV systems, transferred them to a newly created YieldCo and received cash which it can use to produce new PV systems.

Following SunEdison two major US manufacturers, First Solar and SunPower, formed a joint YieldCo, 8point3, the assets of which are 100% PV and which went public on June 19, 2015. This is also a good example of the Solar Breeder system: they manufactured PV systems, transferred them to a newly created YieldCo, and received US $420 million cash which they can use to produce new PV systems. The strange name, 8point3, derives from the fact that it takes 8.3 minutes for the sun’s radiation to reach the earth.

Thus, in 2014/2015 all of the three major US PV manufacturers established their first YieldCo.

The announcement by Neo Solar Power Corporation (NSP) of Taiwan that it is planning to establish a YieldCo in 2015 indicates that the YieldCo idea has spread to the Asian PV manufacturers. It is now only a matter of time before the many Chinese, Korean and Indian PV manufacturers will see the light and establish YieldCos as well. The money to be raised for PV systems b y this approach will dwarf Warren Buffett’s US $2.5 billion which his company invested in the Antelope Valley Solar Projects in California.

Why PV assets will be preferred in YieldCos

As we saw, at the outset the assets of YieldCos were primarily hydro and wind systems. Now they are turning more and more to PV. The three US PV manufacturers started their YieldCo’s with 100% PV assets. There are two main reasons why PV in future will dominate the assets assembled to create YieldCos.

Location: In order to establish a RE YieldCo one needs to build or acquire RE electric power generating system(s). These systems could be hydro, wind, concentrating solar and solar PV. Of these systems hydro, wind and concentrating solar can only be established where there is water, sufficient wind or direct, unscattered sunshine available. These are only available in a limited number of places on earth. PV systems on the other hand can be established in most parts of the Earth where people live. An example is Germany which is not the sunniest part of our planet. It is located quite far north and it has lots of cloudy days but at this time there is more PV capacity installed in Germany than in any other country. This means, that YieldCos utilizing PV assets could be anywhere. The other RE assets are more limited and soon only a limited number will be available for YieldCo.
ROFO: For tax reasons YieldCos have to invest constantly in new assets to assure the growth of income for distribution to shareholders. It is therefore extremely important that the YieldCo has a contract with the technology “sponsor” (originator) to be able to obtain assets that the “sponsor” is developing. This ensures a pipeline for future assets and a “right to first offer” (ROFO) for the assets. This strange wording is a remnant of REIT, the ancestor of YieldCo, and means “Right of First Negotiation”, so that the “sponsor” should have good faith negotiations with the YieldCo before negotiating with other parties. The idea behind this is that the YieldCo should have an assured path to new assets. To assure a pipeline in hydro or wind is complicated as they have to be found at a proper location and may not be always available. However, if a PV manufacturer is the “sponsor” it can assure the continuation of new PV assets in any size and location at any time when needed, because the PV manufacturer’s business is to produce them continuously. PV applications are ubiquitous and can be installed quickly.
The advantage of the YieldCo system for PV manufacturers

PV YieldCo is the perfect solar breeder. A YieldCo’s shares when sold can be used as a source of low cost money for producing more PV systems. The beauty for the manufacturer is, that by establishing a YieldCo based on the PV manufacturer’s need of cash it can sell
all the shares or
as many shares for as much money as the PV manufacturer needs, and enjoy the income from the unsold shares and
may retain management and maintenance contracts, which provides additional income.
PV manufacturers for a long time will not have to face overcapacity and unsold inventory, because it can be used to produce YieldCos.
PV manufacturers do not have to find single investors like Warren Buffett’s company which can afford to invest lots of money to buy a large utility size PV system. People can buy the YieldCo shares in any quantity and it has been shown that it was not a problem for PV YieldCos to generate many hundreds of millions of dollars of investment capital.
Finally, a PV YieldCo offers significant advantages over an investment in a fossil fuel power generating system. Fossil fuel power plant needs three things to be economically successful: a long term agreement for fuel supply at reasonable cost; capital investment to build the plant; and a long term guaranteed customer base.

For a PV YieldCo these issues are vastly simplified: one does not have to secure a long term contract for the fuel, because the nuclear reactor in the sun provides it free of charge; raising money on the stock market for a YieldCo turns out to be much easier than convincing lenders to provide the large amount of money to build a fossil fuel plant; and there is no need to look for customers who would sign a long term contract, as PV systems can be built anywhere and can reach customers easily: through the utilities by the existing grid or by a mini-grid; or directly when they are off-grid.

YieldCos’ influence on the future

For all these reasons, I have come to the conclusion that the effect of global implementation of the PV YieldCo system will radically increase the growth of the utilization of PV and accelerate the expansion of PV companies. More than that: it will also affect the solar PV distribution system, influencing other industries at the same time, for example reshaping the business model of utilities. Financial revolutions can be no less important than technological revolutions.

© Peter F. Varadi. All rights reserved

Peter F. Varadi wrote a history of the early years of the solar industry, Sun Above the Horizon, published last year by Pan Stanford Publishing, and reviewed here on Energy Post.

Comments on EPA’s Recently Released Report on Fracking

On June 4th the U.S. Emvironmental Protection Agency (EPA) released its draft ‘Assessment of the Potential Impacts of Hydraulic Fracturing For Oil and Gas on Drinking Water Resources’. It can be accessed at www.epa.gov/hfstudy. It was several years in the making, and was undertaken at the request of the U.S. Congress.

image

On June 8th I was contacted by Roy Hales, Editor of ‘The EcoReport’ with whom I have worked previously. He asked if I would be willing to be interviewed on my reactions to the draft report, given that I and two Swedish co-authors had published a major review of fracking the previous August (see my blog post entitled ‘Shale Gas and Hydraulic Fracturing-Framing the Water Issue’). I agreed, I read the EPA slide presentation on the assessment as well as the 28-page Executive Summary, and the phone interview took place that evening. My thoughts, and those of one other interviewee, are summarized in the following piece published by Roy in his ejournal (www.theECOreport.com) late last night.

“THE EPA’S PAINFULLY INADEQUATE FRACKING ASSESSMENT
JUNE 8, 2015 ROY L HALES
Hydraulic Fracturing for Oil and Gas and Its Potential Impact on Drinking Water Resources

By Roy L Hales

After five years of research, the EPA’s painfully inadequate fracking assessment has been released. “It’s a bit underwhelming,” said Amanda Frank, from the Center for Effective Government. Dr Allan Hoffman, a retired senior analyst with the Department of Energy, referred to the draft report as “disappointing.” They were referring to the extent that industry was allowed to thwart the EPA investigation.

image
Figure ES -1 . Schematic cross – section of general types of oil and gas resources and the orientations of production wells used in hydraulic fracturing. Shown are conceptual illustrations of types of oil and gas wells. A vertical well is producing from a conventional oil and gas deposit (right). In this case, a gray confining layer serves to “trap” oil (green) or gas (red). Also shown are wells producing from unconv entional formations: a vertical coalbed methane well (second from right); a horizontal well producing from a shale formation (center); and a well producing from a tight sand formation (left). Note: Figure not to scale. Modified from USGS (2002) and Newell (2011) .

“My general reaction is ‘why bother?’ I have a lot of compassion for EPA, they must have really struggled with this one, but I don’t feel like they produced a very useful report. There is nothing new. It is accurate as far as I could tell. They did review some records, but then they put in all these caveats about how limited the data really was. It is very clear they probably didn’t get co-operation from the industry. That’s a very bad sign in my opinion,” said Dr Hoffman.

The EPA tried to get companies to monitor their wells. They need to test the water before they started drilling, test during the drilling and test afterwards.

“Most companies flat-out refused to comply. So this report is more of a literature review. It is very thorough, in terms of looking at the available data, but limited because they still can’t say how widespread these impacts are when there so few companies that are willing to let the EPA study them,” said Amanda Frank.

She added, “They admit in the conclusion that, based on the number of wells that we know of and based on the number of incidents that we know of, water contamination is not a widespread issue. But the next sentence basically says there is so much data missing that it is hard to make that claim.”

Hoffman recently co-authored a report on the impact hydraulic fracturing has on water. He shares the impression that the number of incidents is small, but added, “We really don’t know.”

“If industry is not going to co-operate on this, then they are not to be trusted. They have plenty of incentive to hide accidents, spills and all that kind of stuff. That’s what people do, they protect their self interest.”

He believes the number of incidents can be brought under control, but suspects that it may take a major accident for the United States to adopt strong enough regulations and enforcement.

A water impoundment at a drill pad in the Fayetteville Shale gas play of Arkansas. The water will be used in the hydraulic fracturing process, where it will be combined with chemicals and sand, then used to create artificial fractures in gas-bearing rocks to allow the gas to be recovered. Photo Credit: Bill Cunningham, USGS

In the meantime, there are reports of water contamination but it is difficult to prove the cause was fracking without proper testing.
If company’s are allowed to withhold the identity of the chemicals they use, you don’t even know what to test for.

There have been large water withdrawals in areas with low water availability. Though the EPA reported the national average was only 1%, in some counties the number was actually 50%.

(Trent Orr, an attorney with Earthjustice, recently informed the ECOreport that much of California’s fracking takes place in Kern county, one of the area’s most affected by the drought.)

In some states, the industry appears to have virtually taken over. In response to communities that have passed fracking bans, both Texas and Oklahoma have passed legislation overruling local control.

“Is fracking going to be safe? Nothing is. There are risks with everything. Getting into my car and driving to work is not ‘safe.’ Industry needs to recognize this and stop trying to say how safe and wonderful it is. They need to acknowledge there are risks. Then we need to ask ourselves, are these risks worth it?” said Frank.

Many hoped the EPA report would help clarify matters.

“The big disappointment is not so much in terms of the report’s scope, as that the conclusions are not widespread. To really fix the problems with fracking, you need to require baseline testing. If we were to require that in every well across the country, we would have a much better sense of how widespread this problem is,” said Frank.”

On June 9th the Washington Post editorialized on the EPA report and basically agreed with the thoughts documented above in Roy Hale’s article. I reprint the editorial below for your information.

“By Editorial Board June 8 at 7:25 PM
IN THE ongoing war over fracking, the loudest voices try their best to obscure this essential point: The controversial drilling technique doesn’t need to be banned; it needs to be well regulated. That’s how we explain the seemingly contradictory reaction to the Environmental Protection Agency’s assessment of fracking’s effects on drinking water, a draft report released last week that industry and environmental groups each spun to support its side. In fact, it supports neither side.

The EPA doesn’t pretend to have a final and precise answer on the scope of fracking’s impact on drinking water. There were sharp limits on its data. But the agency used 950 sources of information from government, industry and environmental groups, so their findings represent the best that science can offer right now. The conclusion: The EPA couldn’t find evidence that fracking has “led to widespread, systemic impacts on drinking water resources in the United States.”

The assessment continued, “The number of identified cases where drinking water resources were impacted are small relative to the number of hydraulically fracked wells.” Given the economic and environmental benefits of using domestically fracked natural gas — which produces less carbon dioxide than coal when burned — the arguments for fracking bans continue to look very weak.

But, the report goes on, there are several possible mechanisms of contamination that drillers and regulators need to treat with a healthy caution: “We found specific instances where one or more of these mechanisms led to impacts on drinking water resources, including contamination of drinking water wells.” Moreover, given the limitations of the available data, there might well have been instances of contamination that have been so far invisible to regulators.

Though the available evidence doesn’t justify banning the technique — as Maryland and New York have done — it clearly calls for sensibly regulating it. Properly cementing new wells is a must. Ensuring that blowout preventers, critical valves and other safety hardware are in good shape is, as well. Lining pits containing contaminated water can prevent seepage into groundwater. Taking care not to drill too close to another well, particularly old and rickety ones, can reduce the possibility of opening cracks in the subsurface geology that promote the movement of tainted water and chemicals.

Government officials need to pay attention to seemingly mundane considerations, too: Spillage from ancillary operations such as trucking wastewater to containment areas can affect drinking water if accidents happen in the wrong places. Promoting the reuse of fracking water would be a way for drought-prone states with significant fracking activity to conserve water for other uses.”